Slopes For The
Interior Of BC
.
Written
by Vera Lindsay
Atmospheric Modeling
Assistant. UNBC
November 1, 2004
|
Project Overview
|
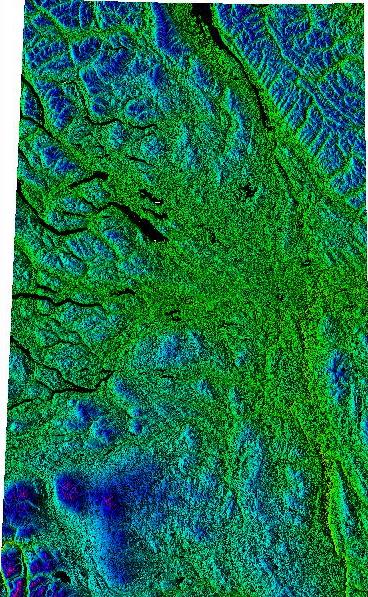
Image of Study Area
|
The purpose of this project was to provide a
statistic to Brenda Moore describing the properties of slope for
the interior of BC. This statistic was to be used as
validation for the creation of a theoretical terrain.
The
area of interest was defined as including the following map
sheets: 93 b,c,f,g,j,k,n, and o.
A data set including all
these map sheets except for 93b had been compiled for a previous
project:
http://www.gis.unbc.ca/courses/geog499/projects/2004/vera_lindsay/index.html
Therefore,
the analysis was done using this pre-existing data set, and the
GIS which contained it, mainly GRASS (Geographic Resources
Analysis Support System). The missing map sheet was
provided by Scott Emmons, (Senior GIS Lab Instructor).
General Data
Information (generated by r.info)
Type of Map:
raster
Number of Categories: 2826
Data Type:
FCELL
Rows:
26428
Columns:
17147
Total
Cells:
453160916
Projection: UTM (zone
10)
N: 6429565.95 S: 5768869.1
Res: 25
E: 585619.54 W: 156943.15
Res: 25
Range of data: min =
196 max = 2826
|
|
Procedure:
The
original data was imported into a pre-existing Albers workspace as
such:
r.in.gdal -o
input=/usr/local/work/TRIM/250KBCTrimDEM/093o/grd/tdem093o/w001001.adf
output=BC_250K_093o title="BC 250K 093o"
(for
full details on this step please refer to:
http://www.gis.unbc.ca/courses/geog499/projects/2004/vera_lindsay/GrassDocumentation.html)
The
map sheets were joined to create one continuous data set
(coverage):
r.patch
input=BC_250K_093c,BC_250K_093f,BC_250K_093k,BC_250K_093n,BC_250K_093o,BC_250K_093j,BC_250K_093g
output=bcslop
Then, the coverage was
reprojected into a UTM workspace so it would be compatible with the
additional 93b sheet and also to allow for measurement in
meters:
r.proj input=bcslop location=dtap2
dbase=/usr/local/work/vera output=bcslope-utm
The 93b
map sheet was imported using the r.in.arc command
Import>Raster
Map>ESRI ARC/INFO ASCII-GRID or
r.in.arc
input= output=
Then r.patch
was run again to goin 93b with bcslope-utm to create
bcslope2.
Statistics of the distribution of slopes over the study
area were produced using the r.stats command:
r.stats
-acpn bc-utm-slope nsteps=20 output=bcslope20.stat
r.stats -acpn
bc-utm-slope nsteps=50 output=bcslope50.stat
The nsteps
variable for the above command can be set to any value between 1 and
255.
The above statistics were re-generated at a
resolution of 500X500 m. The image was converted to a lower
resolution through setting the north-south grid resolution and
east-west grid ressolution to 500 in g.region.sh:
Region>Manage Region
(Grass performs all functions on the current region.)
Results:
bcslope50_res25.stat
bcslope50_res500.stat
Image Info:
The image at the
top of the page is an enhanced version of bcslope2.
The
enhancement process included the below commands which can be run as a
script:
region=bc-utm-slope
dem=bcslope2
twenty=$dem.20x
shade=$dem.shade
rescale=$twenty.rescale
g.region
raster=$region
shade.rel.sh
altitude=45 azimuth=315 elevation=$dem
r.mapcalc
$twenty=20*$shade
r.rescale
input=$twenty output=$rescale to=1,255
For
further details on the above enhancement procedure, location (workspace) set up,or general GRASS use, please
read:
http://www.gis.unbc.ca/courses/geog499/projects/2004/vera_lindsay/GrassDocumentation.html
or
http://grass.itc.it/gdp/html_grass5/index.html
For further information contact lindsayv@unbc.ca