Graphs for Entire MLFD
These consist of three data sets:
The single graph represents the conditions over the entire MLFD.
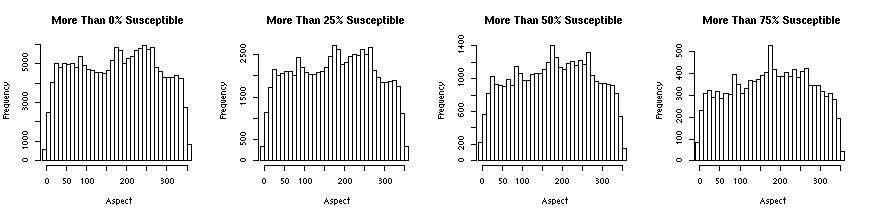
The Pine data set identifies the percentage of pine in a given area and the Susceptibility data set identifies how susceptible the pine areas are to MPB infestation as predicted by the Shore and Safranyik susceptibility model. These data sets represent conditions in 1995.
All data sets are at a spacial resolution of 200m.
Table 1
The single graph represents the conditions over the entire MLFD.
The Pine data set identifies the percentage of pine in a given area and the Susceptibility data set identifies how susceptible the pine areas are to MPB infestation as predicted by the Shore and Safranyik susceptibility model. These data sets represent conditions in 1995.
All data sets are at a spacial resolution of 200m.
Table 1
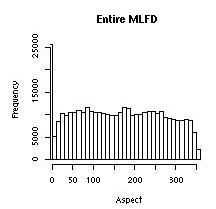 |
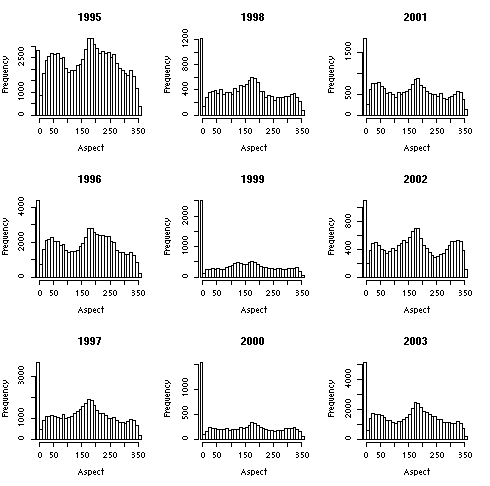
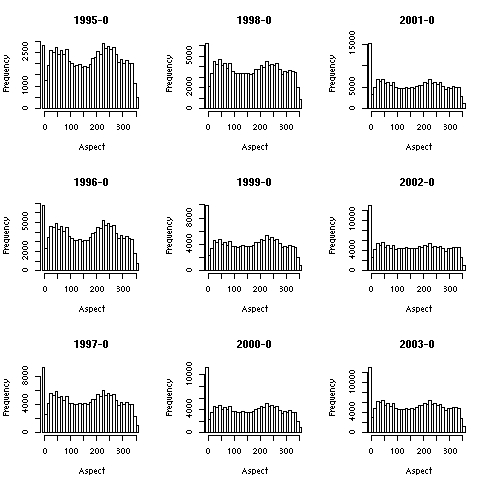
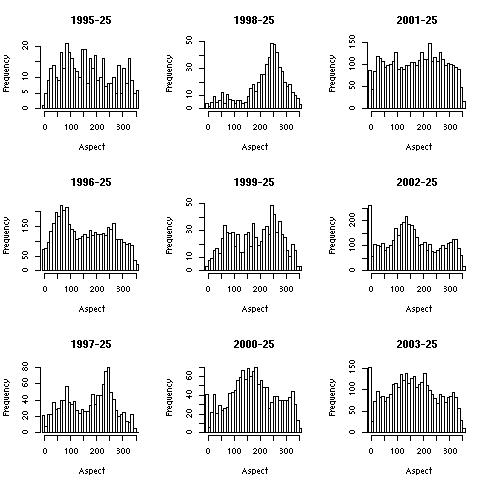
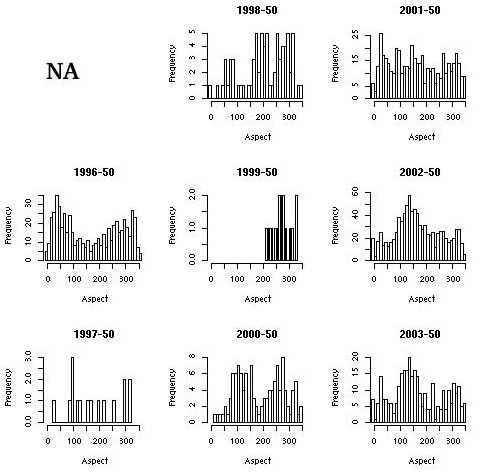
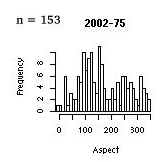
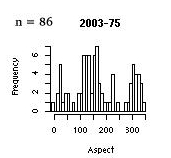
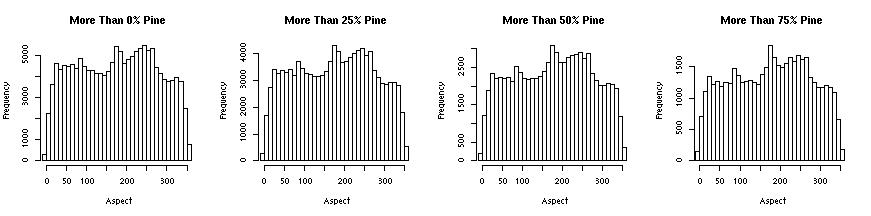
In general, south facing
slopes around 160º to 180º are slightly more prevalent in
the MLFD. Slight peaks also exist in the south west west
(225º-275º) and north north east (25º-75º)
directions. Pine coverage and MPB infestation susceptibility are most prevalent on south facing slopes between 160º to 180º as well as south west west facing slopes between 225º to 275º. A less pronounced peak also exists in the north north east direction (25-75), however, this trend diminishes as pine cover and susceptibility increases. The trends observed for the MLFD as a hole are more pronounced in pine covered areas, especially for the south and south west west facing slopes. |
 |
|
 |
|