Graphs for Entire MLFD
These consist of three data sets:
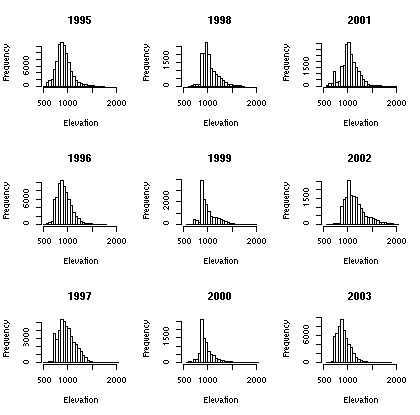
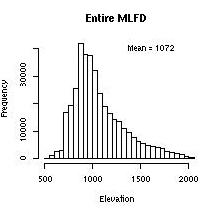
The single graph represents the conditions over the entire MLFD.
The Pine data set identifies the percentage of pine in a given area and the Susceptibility data set identifies how susceptible the pine areas are to MPB infestation as predicted by the Shore and Safranyik susceptibility model. These data sets represent conditions in 1995.
All data sets are at a spacial resolution of 200m.
Table 1
|
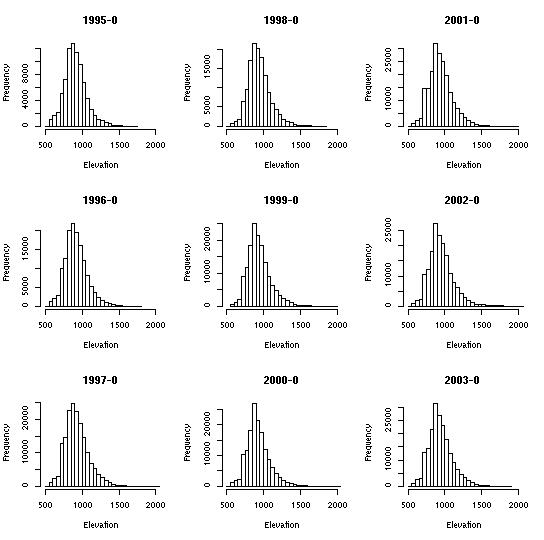
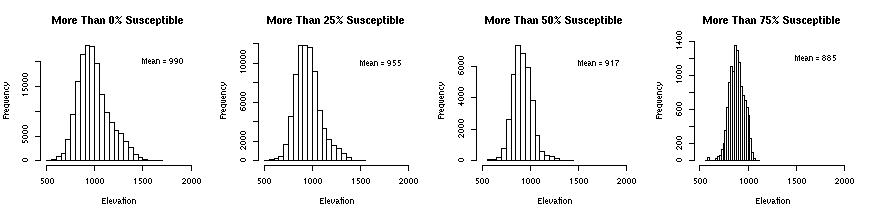
Pine coverage is
limited by elevation at 1500m. The greatest coverage occurs
between 800m and 1100m for pine densities below 75% and 800m to 900m
for pine densities above 75%. Susceptibility follows the pine coverage extents. |
 |
|
 |
|