Graphs for Entire MLFD
These consist of three data sets:
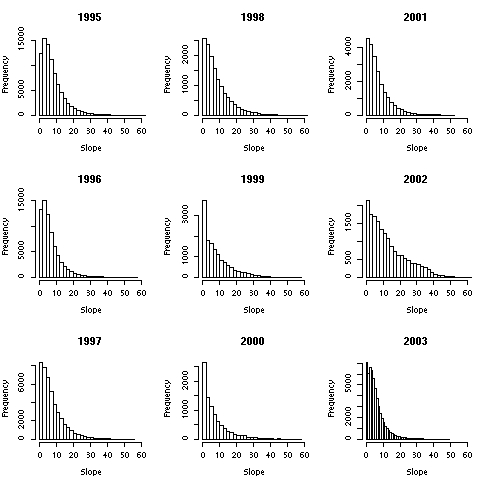
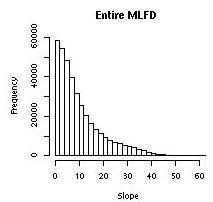
The single graph represents the conditions over the entire MLFD.
The Pine data set identifies the percentage of pine in a given area and the Susceptibility data set identifies how susceptible the pine areas are to MPB infestation as predicted by the Shore and Safranyik susceptibility model. These data sets represent conditions in 1995.
All data sets are at a spacial resolution of 200m.
Table 1
 |
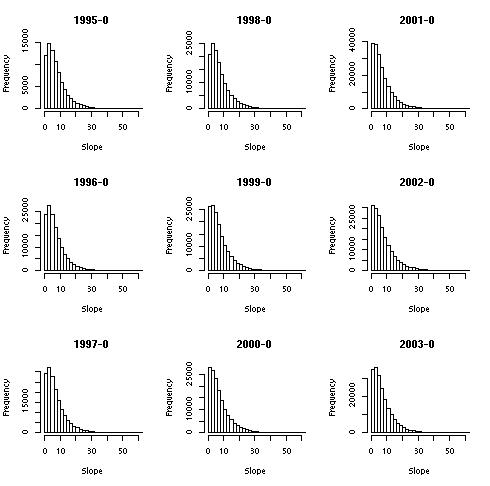
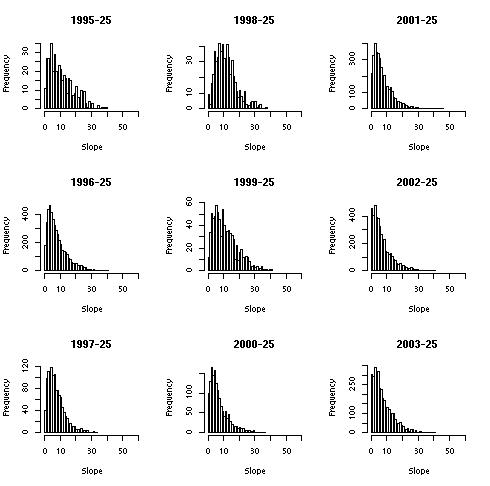
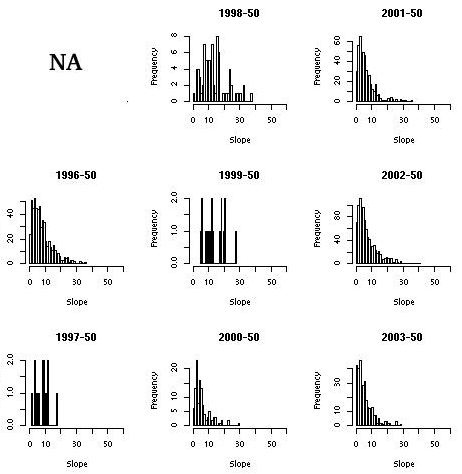
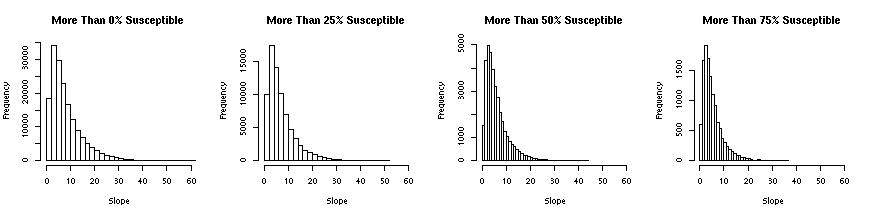
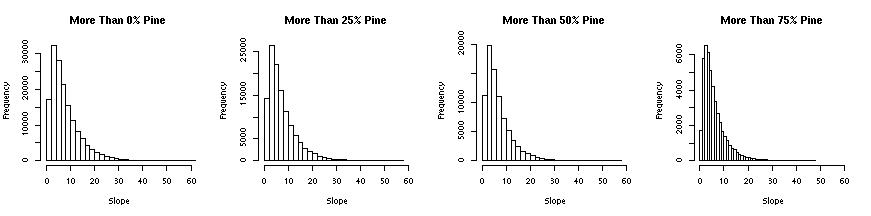
The pine and susceptibility distributions of slope match those of the entire forest district except for a slight decrease on flat terrain. This is undoubtedly due to the effect of lakes. |
 |
|
 |
|