Graphs for Beetle Infested Areas
coverages: MPB(yr)
NOTE: Since these coverages
represent cumulative data sets areas with beetles over consecutive
years will be represented repetadly.
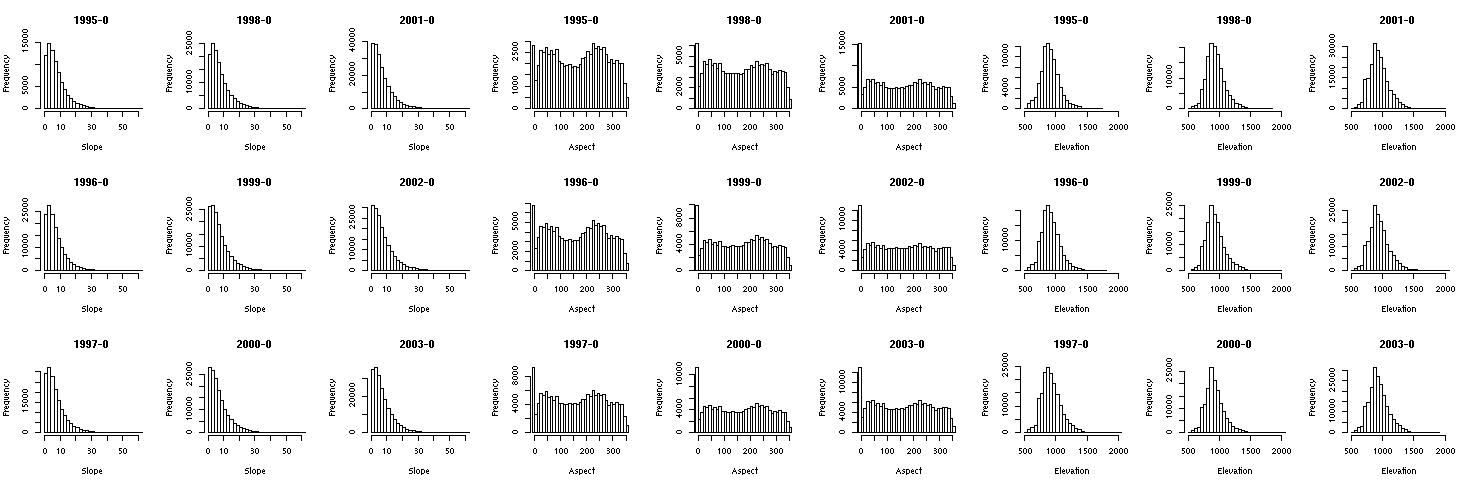
Areas affected by beetles to any extent (ie: more the 0% Beetle infestation)
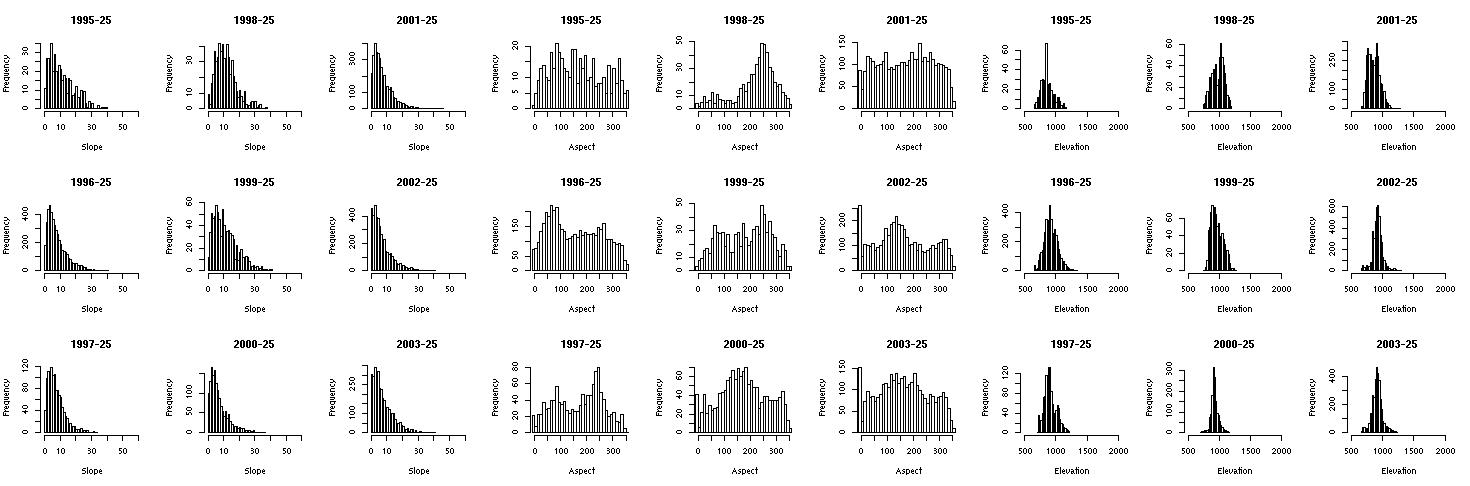
More than 25% beetle infestation:
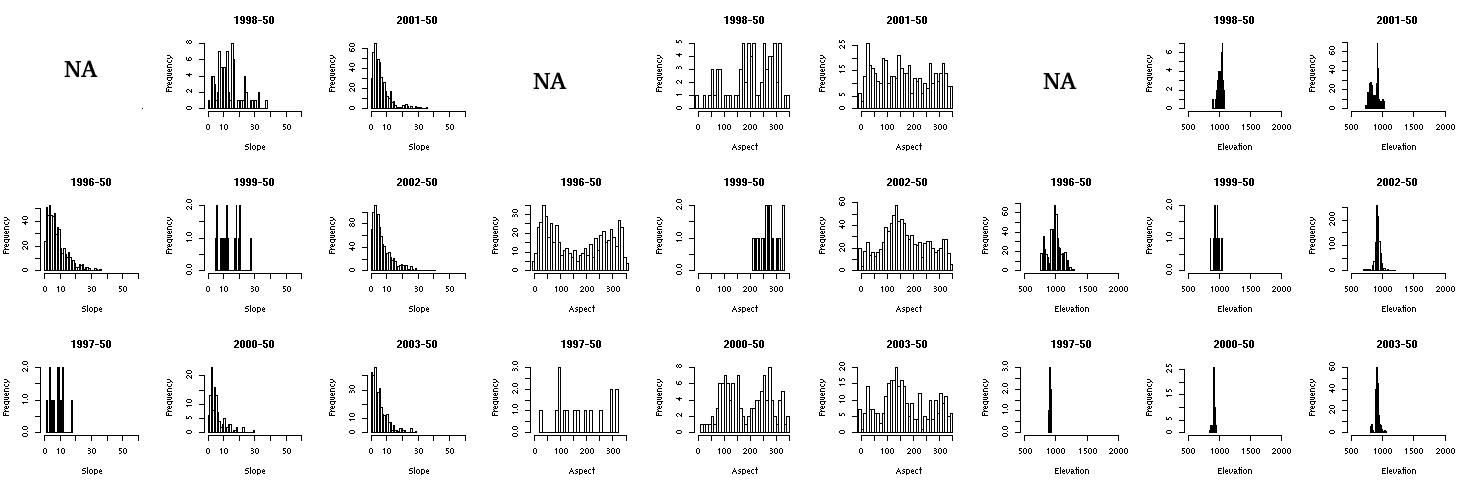
More than 50 % beetle infestation:
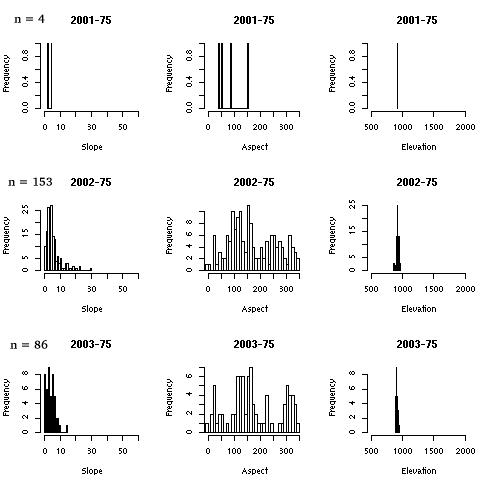
More than 75% Beetle infestation:
Note that 1995-2000 do not have beetle infestations of this severity and that the n value for 2001 is also very low.