|
Map Typing Summary For 500mb Pressure
|
|||||||||||||||||||||||||||||||||||||||||||||
| |
Vera | Janice | Same | Double in Same |
Hourly ** |
||||||||||||||||||||||||||||||||||||||||
| Ridge
to the West |
|
||||||||||||||||||||||||||||||||||||||||||||
| Ridge
to the East |
|||||||||||||||||||||||||||||||||||||||||||||
| Ridge
Over Head |
|||||||||||||||||||||||||||||||||||||||||||||
| Not
classified |
|||||||||||||||||||||||||||||||||||||||||||||
| Double
Classified |
|||||||||||||||||||||||||||||||||||||||||||||
| west
+ east |
|||||||||||||||||||||||||||||||||||||||||||||
| west
+ over head |
|||||||||||||||||||||||||||||||||||||||||||||
| east
+ over head |
|||||||||||||||||||||||||||||||||||||||||||||

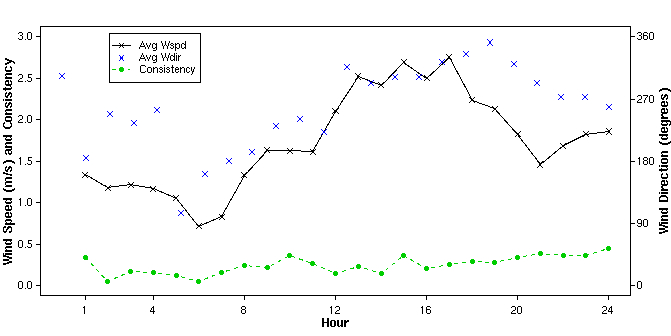
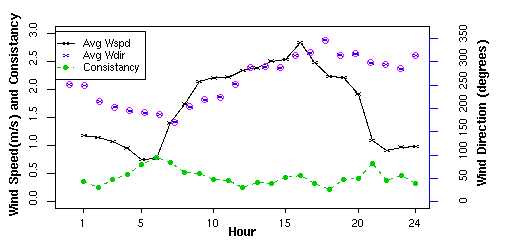
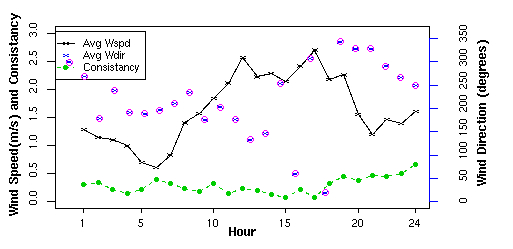
| RTE |
RTW |
 |
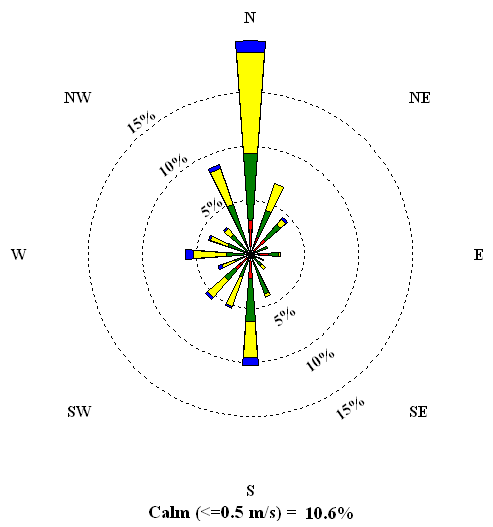 |
| ROH |
All |
 |
 |