Assessment Of The Relationship Between
MPB Spread
and Wind Patterns
for the Morice Lakes Forest
District
directory name: PFC
Project description:
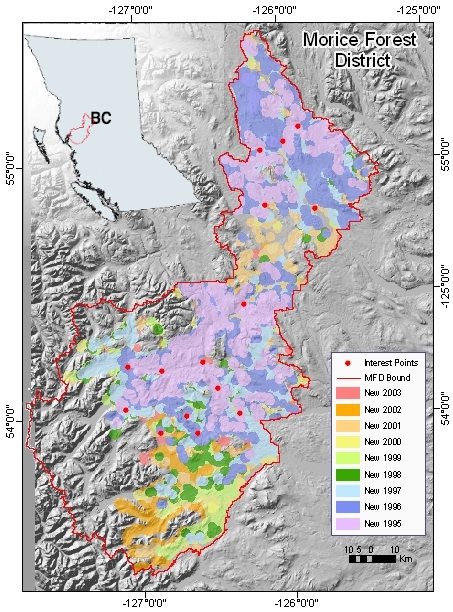
The aim of this project is to asses the relationship between
Mountain Pine beetle(MPB) spread and wind patterns. The first
step
is to asses the relationship between elevation, slope, and aspect and
MPB spread.
Data Summary:
The MPB spread data was obtained from
T. Nelson for the Morice Lakes Forest District (MLFD) for 1995 to 2003.
http://www.mpb-research.org/Spatial_Temporal/
The original DEM associated with this
data did not cover the full
extent of the MB spread data. Therefore a new DEM was compiled
(source:www.geobase.ca).
The area is covered by map sheets 93M, L, E, N, K, and F.
Results
|
Yearly Growth for the MLFD
1995 - 2003
|
Table 1
General Statistics
|
|
|
| 1995 |
1995 |
1996 |
197 |
1998 |
1999 |
2000 |
2001 |
2002 |
2003 |
| FREQUENCY |
84372 |
69274 |
43388 |
13863 |
13897 |
8801 |
21650 |
16776 |
55546 |
| MEAN-SLOPE |
7.68 |
6.49 |
7.46 |
8.04 |
7.93 |
6.86 |
6.98 |
12.61 |
5.49 |
| STD-SLOPE |
6.36 |
5.71 |
6.77 |
7.35 |
8.07 |
7.59 |
6.45 |
10.45 |
4.99 |
| MIN-SLOPE |
0.00 |
0.00 |
0.00 |
0.00 |
0.00 |
0.00 |
0.00 |
0.00 |
0.00 |
| MAX-SLOPE |
73.95 |
57.11 |
54.27 |
61.96 |
56.69 |
57.30 |
51.24 |
64.64 |
48.87 |
|
|
|
|
|
|
|
|
|
|
| MEAN-ASP |
167.76 |
160.42 |
156.87 |
155.70 |
142.97 |
146.27 |
153.57 |
166.71 |
154.22 |
| STD-ASP |
97.74 |
99.68 |
100.09 |
101.41 |
107.43 |
110.92 |
105.36 |
105.11 |
102.02 |
| MIN-ASP |
-1.00 |
-1.00 |
-1.00 |
-1.00 |
-1.00 |
-1.00 |
-1.00 |
-1.00 |
-1.00 |
| MAX-ASP |
358.88 |
357.66 |
357.90 |
358.73 |
358.43 |
357.79 |
358.12 |
358.95 |
358.82 |
|
|
|
|
|
|
|
|
|
|
| MEAN-ELEV |
909.04 |
923.64 |
976.08 |
1031.55 |
995.56 |
963.11 |
1032.61 |
1142.27 |
908.87 |
| STD-ELEV |
145.80 |
148.14 |
177.82 |
152.26 |
175.59 |
154.89 |
165.62 |
210.74 |
141.47 |
| MIN-ELEV |
548.00 |
546.00 |
549.00 |
623.44 |
587.00 |
589.52 |
588.05 |
587.11 |
588.44 |
| MAX-ELEV |
1726.36 |
1775.66 |
2066.81 |
1748.30 |
1967.30 |
2000.92 |
1966.57 |
2084.06 |
1867.19 |
|
|
|
|
|
|
|
|
|
|
| MEAN-BEETLE |
3.20 |
3.21 |
1.14 |
0.59 |
0.97 |
0.97 |
0.88 |
1.90 |
3.86 |
| STD-BEETLE |
4.56 |
6.14 |
1.94 |
1.04 |
1.88 |
1.49 |
1.24 |
3.53 |
5.39 |
|
|
|
|
|
|
|
|
|
|
Distances between nearest
polygon centers for consecutive years
Measured in meters
| YEAR |
# of Points |
MIN Distance |
MAX Distance |
MEAN
Distance |
| 1995
-1996 |
49 |
0 |
10783 |
1961 |
| 1996 -
1997 |
229 |
0 |
10313 |
2419 |
| 1997 -
1998 |
333 |
0 |
27309 |
6375 |
| 1998 -
1999 |
174 |
0 |
14437 |
4007 |
| 1999 -
2000 |
218 |
0 |
22368 |
4074 |
| 2000 -
2001 |
191 |
0 |
10948 |
2906 |
| 2001 -
2002 |
261 |
200 |
52735 |
6568 |
| 2002 -
2003 |
161 |
100 |
24515 |
4589 |
| All |
|
|
|
4112 |
| All
without 1995 |
|
|
|
4420 |
|
|
|
|
|
|
Graphs for:
Aspect
Elevation
Slope
Station Winds
Vector analysis
Analysis of specific Areas
GIS Procedures
AML
Directory
For further Information Contact Vera
Lindsay
lindsayv@unbc.ca